
A busy organisation is not the same as a well-run one. This article explains why teams build workarounds, what those workarounds hide, and a practical framework for improving operational visibility without buying more software you do not need.
In this article
Walk into most growing organisations and the activity is obvious. The order desk is answering customers, planners are moving dates, finance is reconciling, warehouse teams are chasing stock counts, and managers are in meetings about all of it. Very little of that is idle time. Yet ask a simple question and it is surprisingly difficult to answer: where is work actually sitting right now, and why?
That gap between activity and insight is what we mean by a visibility problem. Leaders can see the output of the business. They cannot reliably see the work. Progress lives in a spreadsheet, in someone's inbox, in a Teams chat, in a planner's head, and in an ERP that only reflects the part of the process it was designed to capture. When those sources disagree, people trust whoever answers the phone.
This is not a niche issue. In Smartsheet's 2026 Operational Excellence Report: Exposing the Resilience Gap, 76% of operations professionals said their organisations rely on workarounds because their tools and processes cannot keep pace with changing priorities. 61% said they lack full visibility into work across the organisation, and only 8% believe their organisation has achieved operational excellence.
About the research: these figures come from an international survey of 1,550 operations management professionals by Smartsheet, covering the United States, United Kingdom, Germany, France, Singapore, Japan and Australia. The Netherlands was not part of that sample. The findings describe a pattern seen across those markets, not a Dutch study, and they are used here as international context.
The report does not suggest that operations professionals are failing. It points at something more structural: the way many organisations have accumulated tools, processes and local fixes over time has made it harder to see the business as one connected system.

Most visibility problems are not discovered in a dashboard. They are discovered when a team maps how work actually moves.
Before looking at solutions, it helps to see how widespread these patterns are. The following figures are from Smartsheet's international 2026 Operational Excellence Report. They are presented as global findings from the countries surveyed, not as Dutch statistics.
76%
rely on workarounds because their tools and processes cannot keep pace with changing priorities.
61%
lack full visibility into work across their organisation.
71%
say fragmented tools and rigid manual processes slow their ability to respond to business challenges and opportunities.
99%
spend time on repetitive, low value tasks every week.
Source: Smartsheet, 2026 Operational Excellence Report. Global survey of 1,550 operations professionals, Netherlands not included in the sample.
Two more findings complete the picture. 63% said they struggle to balance efficiency with adapting to business change, and only 8% believe their organisation has achieved operational excellence. Put together, these numbers describe organisations that are working hard, compensating constantly, and still finding it difficult to see whether the compensation is working.
Workarounds are not a discipline problem.
They are a signal that the process and the system no longer agree.
Operational visibility is not the same as having dashboards. A dashboard full of numbers nobody trusts, refreshed once a month, does not make a business visible. Operational visibility means that the people who need to make decisions can reliably answer a small set of questions at the moment they need to:
When those questions are easy to answer, good management happens almost by default. Delays are spotted while they are still small. Resources move to the place where the actual constraint is, rather than where the loudest complaint came from. Recurring problems surface as patterns instead of surprises. And when priorities change, which they always do, the business can re-plan without rebuilding its own reporting from scratch.
When those questions are hard to answer, the cost is not just slower reporting. Decisions get pushed up to people with the widest overview, which is a bottleneck of its own. Teams start keeping their own version of the truth, because the official version is not timely or not trusted. Problems are discovered by customers before they are discovered by management. None of this shows up as a line item, which is exactly why it tends to persist.
It emerges from three things working together: processes that are defined clearly enough to be repeatable, systems that capture the work where it happens, and reporting that reflects the same definitions everyone agreed on. Fix only one of the three and visibility stays partial.
Almost no one sets out to create a workaround culture. It develops in small, sensible steps. A customer asks for something the system cannot represent, so someone keeps it in a spreadsheet. A field is missing, so a colleague adds a column to their own copy. An approval cannot wait for the next system cycle, so it happens over email and is recorded later, or not at all.
Each of those decisions is reasonable in the moment. The problem is that they are made by individuals, at different times, in isolation. The result is a set of parallel processes that only the people who built them fully understand.
A file becomes the real operational record, with its own rules, versions and owner. It is fast to create and very hard to govern.
Requests and approvals travel through inboxes. Status exists only in the thread, and the thread is only visible to its participants.
The same information is typed into two or three disconnected applications. Each copy drifts, and no one can say which is current.
Two teams perform the same process differently. Both work, but the results are not comparable and cannot be reported together.
None of these are caused by employees who do not care. In most cases the opposite is true. The people building workarounds are the ones trying hardest to keep commitments to customers and colleagues. When a system cannot express how the work really happens, the workaround is the employee's attempt to protect the outcome.
A workaround is usually the most reasonable response to an unreasonable process. Treat it as evidence, not as a compliance failure.
The practical consequence is that the business develops two operating models: the documented one that management reviews, and the real one that keeps the work moving. Improvements get designed against the first, which is why so many process initiatives struggle to change the second. This is closely linked to why business software so often forces teams to work around it, and to the signals we described in five signs your operations software is holding you back.

Every spreadsheet and manual record that keeps the work moving is also a place where visibility is lost.
When visibility is poor, the instinct is to buy a tool that promises it. A new planning module, a task tracker, a reporting platform, another integration layer. Each is bought for a real reason, and each arrives with its own data model, its own permission structure and its own definition of what a "completed" order or a "closed" case means.
Unless the underlying process is understood first, that approach tends to make the original problem worse. A new tool does not remove a workaround. It becomes one more place where work has to be recorded, and one more source that has to be reconciled when someone needs a complete answer. The organisation ends up with more data and less clarity.
A visibility gap appears because the process crosses systems or teams that do not share information.
A new application is introduced to close the gap, without changing the process that created it.
Teams must now record the same work in the old and the new place, so a workaround is created to avoid double entry.
The gap widens, and the cycle restarts with the next tool.
This is not an argument against technology. It is an argument for sequence. Before deciding what to build or buy, it helps to understand four things: how the process actually runs, what information has to move and where, who is accountable at each step, and what the business genuinely requires from the outcome. Those questions are cheap to answer and expensive to skip.
Technology should support a process the business already understands. When it is chosen first, it usually ends up defining the process by accident, through whatever the tool happens to make easy.
Understand the process, then choose the technology. Doing it in the other order is how organisations end up with more systems and less visibility.
The framework below is deliberately not a technology checklist. It is a sequence that keeps the business problem in front and treats technology as a means. Not every organisation needs all seven steps in equal depth, but skipping the first two almost always undermines the rest.
Not every process deserves attention. Start with the few that directly affect revenue, delivery reliability, customer experience or working capital. Map them as they actually run, including the informal steps, rather than as they are documented.
Mark every point where work leaves one system or team and enters another. Most visibility loss sits exactly at those boundaries. Note where the same data is captured twice, and where a decision waits for someone to gather information first.
Every step needs one accountable owner. Then agree a small number of indicators that people will actually use, defined the same way everywhere. Ten trusted measures beat fifty disputed ones.
Decide which system is the source of record for each type of information, then make that information available where it is needed instead of being re-typed. This is where system integration usually does the most useful work.
Automate only after the process is understood and simplified. Otherwise you automate the inefficiency. When no existing tool fits how the work has to run, a focused custom business application is often a better answer than a fourth general purpose platform.
Reporting should answer the questions agreed in step three, from data that is captured as part of the work rather than assembled afterwards. Start small and close to daily decisions, then expand.
Compare against the baseline, adjust what is not working, and revisit the process as the business changes. Visibility is maintained, not achieved once.
Prioritise by business impact, effort, risk and feasibility. A high impact change that requires two years and a full replacement is rarely the right first move. A narrow fix that removes a weekly manual reconciliation and makes status visible often is.
Once the process is understood, a small number of capabilities usually do most of the work. They are not interchangeable, and no organisation needs all of them at once. The right combination depends on where the visibility gap actually is.
Removes the unnecessary separation between business systems so the same information does not have to be re-entered. It also makes one system the reliable source for a given data type, which is a precondition for trustworthy reporting.
Standardises repeatable tasks and hand offs: routing, notifications, approvals, document generation, reconciliation. Hand offs that used to live in inboxes become visible steps with a status and an owner. See our workflow automation services for how this is typically scoped.
Support processes that existing software does not adequately cover, without forcing the business into a spreadsheet. A focused application captures work at the point where it happens, which is what makes visibility possible in the first place.
Let leaders monitor the indicators agreed up front, from data that is already captured. The point is not more charts. It is fewer, trusted numbers that support a decision without a meeting to explain them.
Some repetitive work benefits from assisted classification, extraction or summarisation, with human review where accuracy matters. AI is useful in specific, bounded cases. It is not a substitute for a defined process, and it does not fix a fragmented data model.
In our experience the most common starting point is not the most impressive one. It is usually a single process that crosses two or three systems, causes manual reconciliation every week, and cannot be reported without someone assembling a file. Fixing that one flow well tends to reveal the next one, and builds internal confidence for the wider effort.
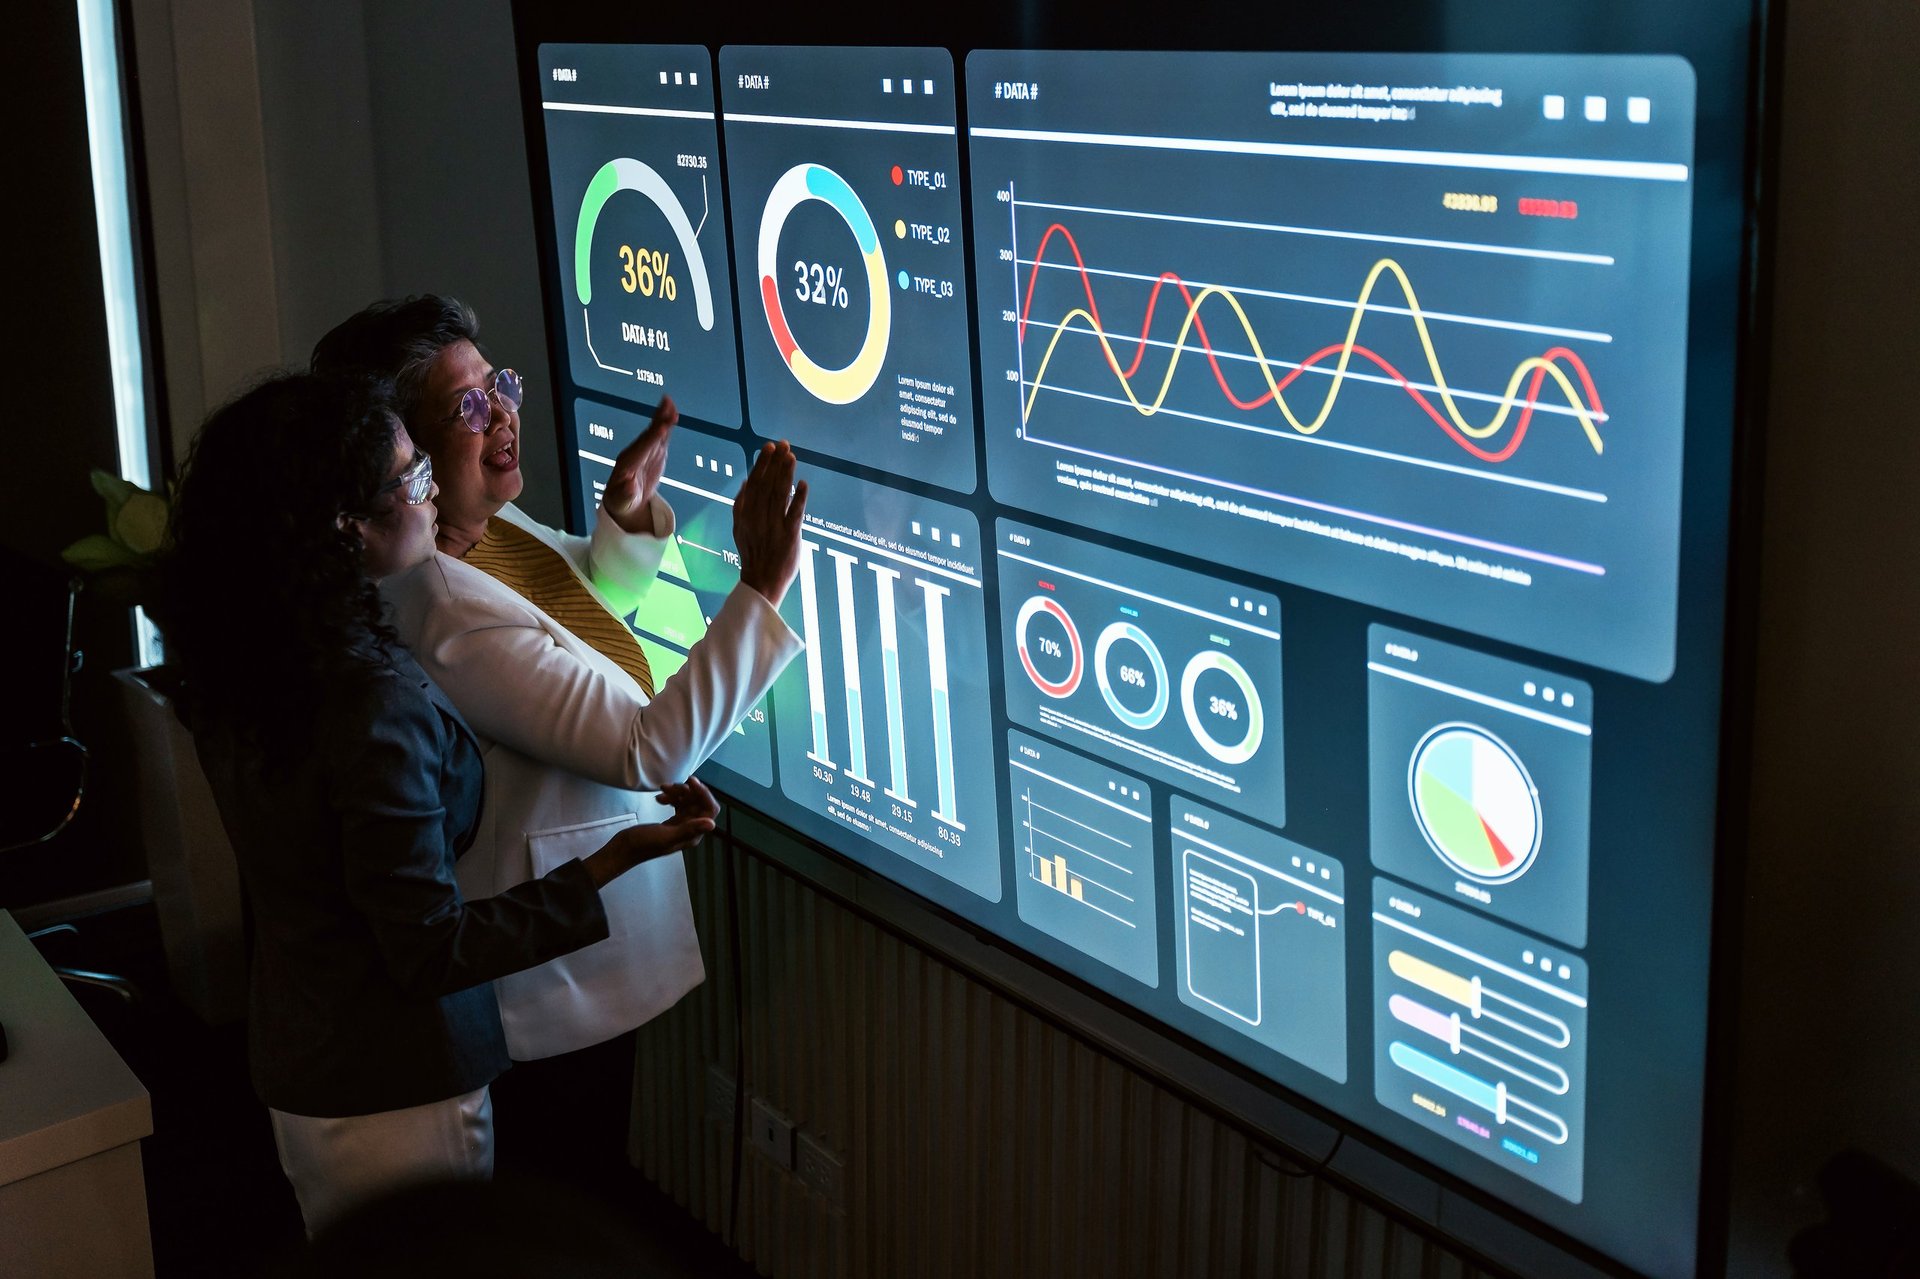
A dashboard is only useful if the data behind it is captured where the work happens.
Improvements that are not measured tend to be debated rather than adopted. The indicators below are practical, observable and available in most organisations once the process has been mapped. The goal is a handful that reflect the problem being solved, not a balanced scorecard on day one.
Establish a baseline before changing anything. That means measuring the current situation honestly, including the workarounds, because those are usually where the real effort sits. Then measure again after the change, using the same definitions. Without a baseline, improvements become anecdotes and are easy to dismiss when budgets are reviewed.
We do not publish percentage improvements here, and we would treat any article that does with caution. Actual results depend on the process, the starting point and how consistently the change is adopted. What can be said confidently is that when work is captured once, in the place where it happens, the difference is usually visible within a few reporting cycles.
We work with organisations in the Netherlands and across Europe, and the patterns above are recognisable here too. This is an observation from client work, not a research claim. The Smartsheet study did not survey Dutch organisations, so no conclusion should be drawn from those figures as if it did.
What we do see regularly is a specific combination of circumstances that makes operational visibility harder than it looks on paper: a dense business landscape where processes cross many organisations, a strong reliance on specialist software for logistics, ERP and compliance, and growth that adds departments faster than it adds coordination between them.
An ERP, a WMS, a CRM, a planning tool, a ticketing system, plus the Microsoft 365 environment everyone lives in. Each was justified. Together they create boundaries where information stops moving and hand offs become manual again.
A process that worked across two teams can become unmanageable across six, especially with multiple sites or an international customer base. Reporting that used to be a conversation suddenly needs definitions, and those definitions are rarely agreed.
When skilled people are hard to recruit, spending their time on re-keying and reconciliation is an expensive choice. Workflows that depend on one experienced person also carry continuity risk that is easy to understate until that person leaves.
GDPR and sector specific requirements mean information has to be traceable and access controlled. A workaround spreadsheet with the wrong permissions undermines both visibility and compliance at the same time, which makes process design and data governance a shared conversation rather than two separate projects.
None of this is uniquely Dutch. It is simply the shape the visibility problem takes for many mid sized and growing organisations in this market. For readers looking specifically at operational excellence as a structured discipline, the approach and engagement models are described on that page.

For organisations in the Netherlands, the visibility problem is usually a coordination problem before it is a technology problem.
At FlexiSolutions we begin with the operational challenge you are trying to solve. That means spending time with the people doing the work, understanding where information breaks down, and agreeing what success would actually look like before proposing anything.
Sometimes the answer is a targeted automation. Sometimes it is an integration between two systems that were never designed to talk. Sometimes it is a focused custom application where no existing tool fits. And sometimes it is a process change that requires very little technology at all. We will say so when that is the case.
Operational excellence and process optimisation
Process analysis, performance improvement and continuous improvement built around measurable outcomes.
Workflow automation
Standardised routing, approvals and hand offs that remove repetitive work and make status visible.
Systems integration
Connecting ERP, Microsoft 365, Dynamics 365 and external systems so data flows instead of being re-typed.
Custom business applications
Purpose built tools for processes that off the shelf software does not adequately support.
Reporting and dashboards
Trusted indicators and reporting that reflect how the business actually runs.
Common questions about operational visibility and manual workarounds
Operational visibility is the ability to see, at any point in time, where work is, who owns the next step, where it is slowing down, and what it depends on. In practice it means managers can answer status questions immediately and trust the answer, without gathering information from several people and files first.
Usually because the process or system does not support how the work actually has to be done. Missing fields, disconnected applications, inflexible approval steps and slow change cycles all push teams to keep work moving outside the official tool. Smartsheet's 2026 Operational Excellence Report found that 76% of operations professionals surveyed internationally rely on workarounds because their tools and processes cannot keep pace with changing priorities.
Start by mapping the few processes that most affect performance, then remove manual hand offs, duplicate entry and unclear ownership before automating anything. Establish a baseline, agree a small set of indicators, improve how information moves between systems, and only then apply automation where repetitive work remains. Efficiency gains tend to follow from clarity, not from adding tools.
Information stops at system boundaries, so people re-enter it manually, maintain parallel records and reconcile conflicting versions. Decisions slow down because no single view exists, and errors are discovered later. In the same international survey, 71% of respondents said fragmented tools and rigid manual processes slow their ability to respond to business challenges and opportunities.
Automate when the process is understood, has been simplified, runs often enough to justify the effort, and involves steps that are genuinely repetitive and rule based. If the underlying process is unclear or inconsistent, automation tends to lock in the inefficiency and make it harder to change later.
When status, capacity and bottlenecks are visible and measured consistently, decisions move closer to the work. Managers can reallocate resources to the real constraint, escalate exceptions instead of routine status, and compare options using the same numbers. It also reduces the volume of reporting requested purely because nobody trusts the existing view.
No. The 2026 Operational Excellence Report surveyed 1,550 operations management professionals in the United States, United Kingdom, Germany, France, Singapore, Japan and Australia. The Netherlands was not included, so the statistics should be read as international context rather than a measurement of Dutch organisations.
If status still comes from a spreadsheet, a mailbox or a phone call, there is a practical way forward. Let's look at one process together and identify where visibility is lost.
Statistics in this article are drawn from Smartsheet, 2026 Operational Excellence Report: Exposing the Resilience Gap (international survey of 1,550 operations management professionals). Netherlands not included in the sample. Read the original report for methodology, full findings and country breakdowns.
Related reading from FlexiSolutions: Operations Excellence services, why business software forces workarounds, system integration and workflow automation.